Check back soon
Once posts are published, you’ll see them here.


The market bounced off the lows from last Monday and offered a trading opportunity for those aggressive traders that chose to capitalize on the recent volatility. As of this writing at 1 am Monday morning, it appears the Asian markets are trading lower and U.S. futures are indicating a lower open. Last week we wrote that we expected a near-term bounce but expected the market to continue lower. We believe the technical damage to the market over the past several days is fairly severe. Investor sentiment may be turning increasingly negative, momentum is weak and the markets remain overvalued in our opinion. We believe it is possible for the S&P 500 to retest the lows from last year at around $1820 over the next several months. We will trade the market to the downside by shorting over-bought situations until there is improvement in the sentiment/momentum picture.

The Next Bear Market
There has been a significant amount of discussion on whether this is a classic correction (+10% stock market decline) or the start of something more sinister. The accepted definition of a “bear-market” is a +20% decline from the peak of a specific index. I came across this interesting piece from JP Morgan (Via Business Insider) that profiled the start of historical bear markets. The article states, “JP Morgan's review of global markets and economies included a look back at the past ten bear markets in US history, dating back to the Great Depression. To qualify, S&P 500 had to drop 20% off the all-time high. Looking at the slide, there are some themes that pop out. Maybe most obviously, 8 of the 10 were accompanied by recessions as defined by the National Bureau of Economic Research. The three main hallmarks JP Morgan observed — commodity spikes, aggressive Fed tightening and extreme valuations — each occurred four times over the 10 bear markets and only once, the 1987 crash, bore none of those hallmarks. Commodity spikes (defined as "significant rapid upward move in oil prices") and aggressive Fed tightening ("monetary tightening that was unexpected and significant in magnitude") occurred together 3 times and is what JP Morgan cites as conditions during the 2007 Global Financial Crisis. While it may simplify broad economic situations, the chart provides an intriguing snapshot of when and why US markets meltdown.”

We firmly believe, based on the data that we currently have that this is a market correction and not the start of a new bear market. The leading economic indicators that we track are showing slow but stable growth, so it doesn’t appear an economic recession is on the horizon. The Fed is going to start a tightening cycle but given the ultra-easy monetary policy in place, a small increase in rates doesn’t appear to be a threat to the market. Commodities are not spiking, in fact quite the contrary the sector has been chronically weak.
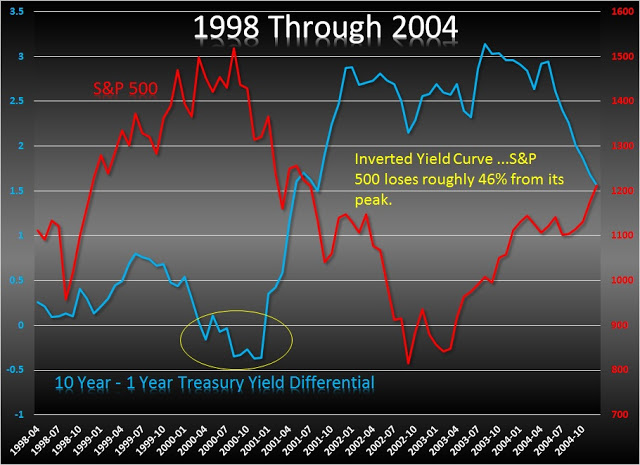
Perhaps the most important item we track is the yield curve. Typically the yield curve will become inverted when economic growth is threatened and the stock market is weakened. I have listed previous points in history when the yield curve had become inverted and subsequent market under performance. The last chart of this series shows where we are today and quite frankly it doesn’t appear to be a major threat signifying a bear market – yet. We’ll be watching closely.




Bottom Line: We expect additional market weakness once this market bounce concludes, possibly through September and October. We may see the S&P 500 retest the levels hit in October of last year. We would like to see valuations come in line and sentiment improve and are hopeful of a renewed rally as we head into the end of the year. Given the current data, we do not see this turning into a severe bear market but will be watching the data closely.
Joseph S. Kalinowski, CFA
Comments