Check back soon
Once posts are published, you’ll see them here.


The month of July has been a relatively choppy trading environment with the major indices posting minor losses for the month. The S&P 500 is down 0.4%, the Nasdaq is down 0.9% and the Dow Jones Industrial Average has given back 0.8% in July. We have been using market weakness as an opportunity to buy. Aside from our proprietary behavioral market model providing buy signals, we have been watching additional market internals in order to further understand where the market may be heading in the near-term.
The following is a list of observations that are worth watching.
Earnings Season
Earnings season kicked off last week with a solid report from JP Morgan Chase and Wells Fargo. This morning Citigroup also posted nice numbers. This week we will see reports from such bellwethers as Goldman Sachs and Intel tomorrow, Bank of America, IBM and eBay on Wednesday and Google and Microsoft on Thursday.
Continued strong results may offer a boost for the market.
Focus on the economy
It appears for the time being, the focus is off Europe and on U.S. economic growth or lack thereof. Continuous reports indicating the U.S. economy is taking a turn for the worse has been dominating the headlines.
Looking at market performance by sector shows market participants delving deeply into these reports and may be an ominous sign of things to come. Further evidence of a market slowdown, while possibly baked into the current market levels could prove the demise of this bounce off the June lows.
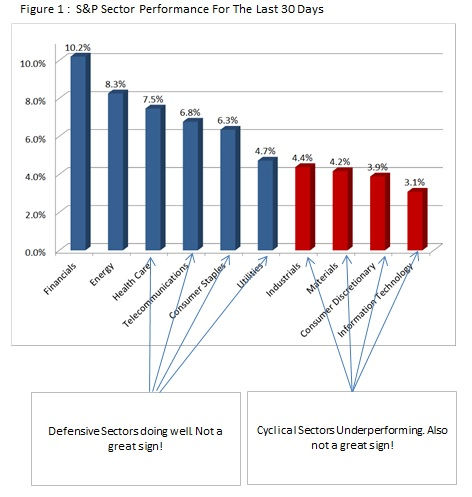
What is somewhat disturbing to us are the way certain sectors have behaved in the past thirty days. In fact, looking at figure 1, one will see that the four sectors that have been underperforming are those that are tied directly to economic growth. Industrials, Materials, Consumer Discretionary (retail numbers where awful this morning) and Technology have not shown significant strength to date and that indicates a weak rally.
Sectors that are economically defensive, Health Care, Staples, Utilities and Telecom are leading the way for the most part. The one saving grace has been the stellar performance surrounding the Financials which is a necessity for any sustained market rally.
How significant is this information.
This sector performance breakdown remains on the periphery of our analysis considering our cyclical vs. defensive model remains in an uptrend (figure 2).
This model compares sector performance of those sectors that are highly sensitive to changes in economic perceptions vs. those sectors that are much more inelastic towards those very same perceptions. Should the orange trend line in this model start to head lower again, we will be forced to take a stronger look at these sector trends and quite possibly alter our bullish biased investment thesis.
In sticking with the sector rotation theme, it is hard not to recognize the significant underperformance of the Nasdaq relative to the S&P. In figure 4, we track the performance between the two indices. As the orange trend line heads lower, that means that the Nasdaq is under-performing the S&P 500 and is indicative of market weakness. As can be seen in the chart, this ratio has recently started lower. This is a negative market event and will be watched closely. That said, this ratio is quite volatile and susceptible to quick changes in direction. One would like to see this trend line downturn as temporary.

The market appears to be sending a message that economic conditions in the U.S. are a cause for concern regarding market direction. While we will continue to follow our current bullish strategy, should this sector analysis deteriorate, we will be quick in changing our stance.
Market Action
What we find slightly encouraging has been the trading action over the past few days. While the indices are down for the month, it doesn’t feel like a correction may be taking place. We say that because there appears to be buyers out there with the same mindset that our models indicate, meaning buy on the dips.
Looking at figure 5, the S&P 500 had several days that rallied back aggressively from its lows of the trading session. And all taking place in the final hours or minutes of the trading day.

The general “feel” of the market is not panic stricken at the moment. We will watch for clues of distribution in the days to come that may alter our investment thesis.
Parabolic Time – Price Model.
We track the Parabolic T/P Model in order to track market trends. When using this model against the weekly S&P 500, it has been instrumental in providing us clues as to market direction and protects us from sticking around during a market correction.
Figures 6 and 7 show how this model behaved over the past five years. It has been remarkable in picking appropriate entry points and more importantly, has kept us out of declining market situations.
What we find encouraging in the recent “uptrend” signal produced from this model. While no one model is a panacea relating to market direction, should this signal be correct in “catching a bid” and starting a new rally, our investors will benefit greatly given our current positioning.

We are getting mixed but slightly bullish signals currently. We will watch our proprietary behavioral and fundamental models as well as those supporting models to determine our next moves.
Joseph S. Kalinowski, CFA
Comments