Check back soon
Once posts are published, you’ll see them here.


Investors beware; the dreaded Hindenburg Omen is upon us. Taken from stockcharts.com, the Hindenburg Omen “warns of potential weakness in the stock market. There are three criteria to activate the omen. First, NYSE new highs and new lows must both be more than 2.8% of advances plus declines. Second, the NY Composite is above the level it was 50 days ago. Third, the number of new highs cannot be more than double the number of new lows. The activation period is good for 30 days. Once active, a sell signal is triggered when the McClellan Oscillator moves below zero and negated when the McClellan Oscillator moves back above zero.”
As seen in the following chart, the first sighting came on April 15th this year. The second sighting occurred on May 29th. When Hindenburg Omen appears in two or more clusters within 36 days of one another this increases the likelihood of a market correction.

One needs to ask why the bears are abuzz this weekend with the HO encounter. According to Robert McHugh, author of "The Recent Hindenburg Omen Observation" “there is a 30 percent probability that a stock market crash - the big one - will occur if we get a confirmed (more than one in a cluster) Hindenburg Omen. There is a 40.8 percent probability that at least a panic sell-off will occur. There is a 55.6 percent probability that a sharp decline greater than 8% will occur and there is a 77.8 percent probability that a stock market decline of at least 5% will occur. Only one out of roughly 13 times will this signal fail."
Market Correlation
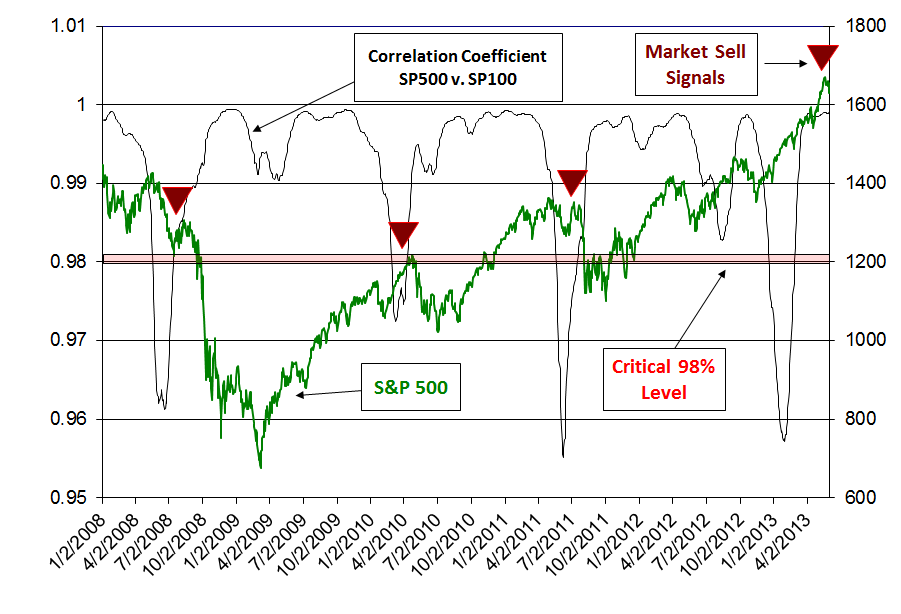
We track the correlation coefficient between the S&P 500 and the S&P 100. Obviously the correlation between the two indices is very high, but there are times when that correlation breaks down. When the correlation coefficient falls below 98% and starts to rise, the market has shown significant weakness.
We witnessed this correlation deterioration in mid-to-late 2008, mid 2010 and 3Q 2011. In the case of 2008, the market dropped over 40%. This was clearly a massive retreat but the other two dates also saw market declines of 17% and 19%, respectively.
Bottom Line: We continue to exhibit market patience and hold large cash reserves. We believe there is more investment money to lose by chasing this rally than by waiting for the appropriate direction.
- Joseph S. Kalinowski, CFA
Comments