Check back soon
Once posts are published, you’ll see them here.


We’ve concluded, purely based on technical analysis, that a FOMO summer rally could start in the coming days or weeks. If we look at the daily chart for the S&P 500, we see two bullish patterns that have emerged. The first one is a bullish cup-and-handle formation with the SPX breaking the rim to the upside. We believe a confirmation rally on stronger volume should propel the SPX to new annual highs.

Additionally, one could argue that we have had a bullish breakout from an ascending triangle formation. There is the longer-term uptrend that started about a year ago that corresponds to the 200-day SMA and a near-term ascending formation that corresponds with the 100-day SMA as support.

Similar to the cup-and-handle pattern, we would like to see the index bounce robustly from the 2800 level on strong volume and we believe we could see the S&P 500 very quickly start making new highs.
There are several confirming signals that we are reading to reinforce this idea. For one, both the Nasdaq and the Russell 2000 are hitting new highs for the year.
On the daily Nasdaq chart, we seem to be having bearish divergences between equity prices and the RSI (14) and the MACD which may bring about some softening, but nevertheless we’re encouraged in the intermediate term that it is a leading index.

After breaking out in May, the Russell 2000 has tested and held certain levels of support and we believe will continue higher. This is highly supportive of our thesis for the SPX catching up and making new highs.

Animal Spirits
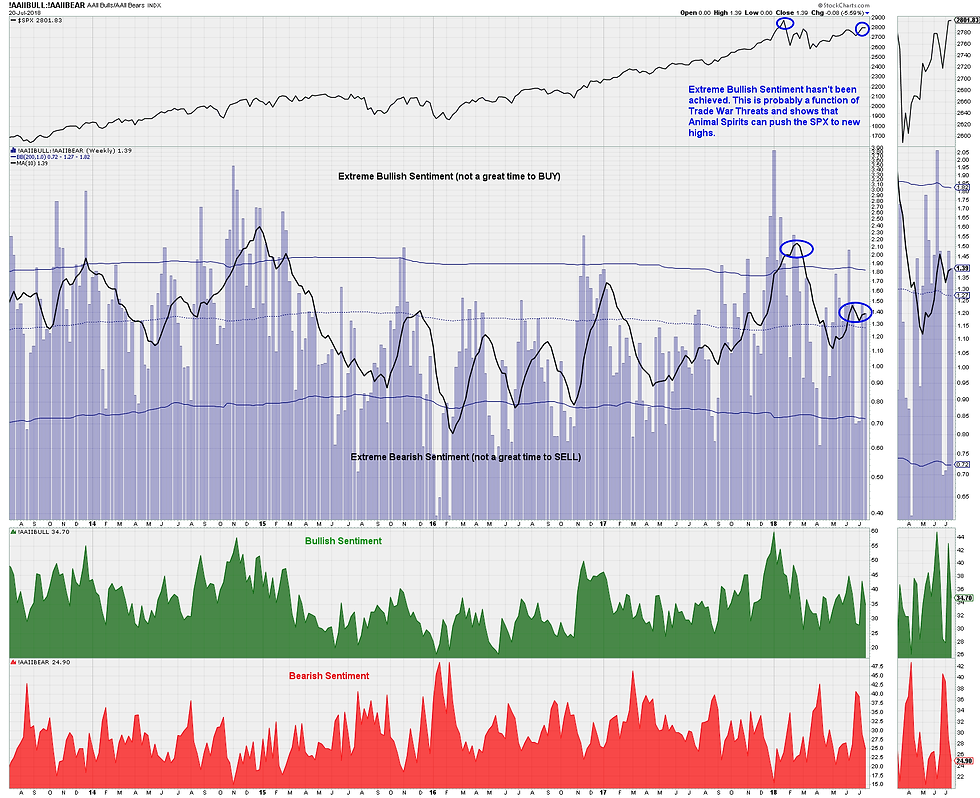
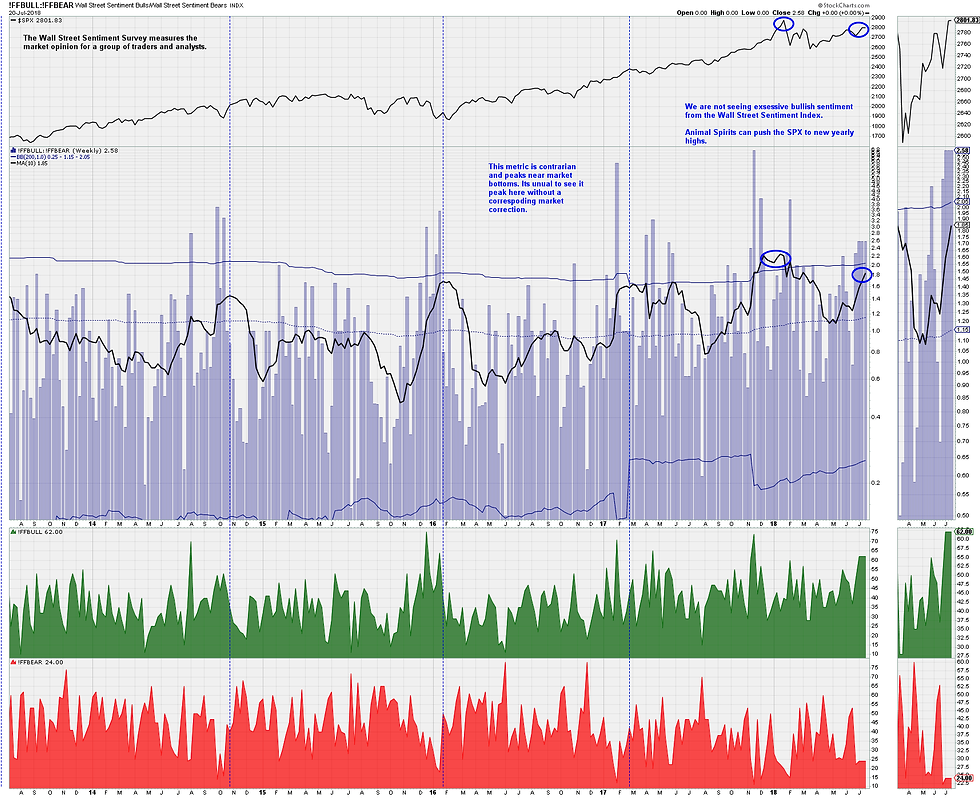
Even with the Nasdaq and Russell 2000 trading at all-time highs, and the S&P 500 within 3% of its all-time high, we’re not seeing excessively bullish sentiment in the markets. This may be a function of the trade war rhetoric that appears to keep a dark cloud on the horizon. With this sentiment overhang on the market, any positive event driven news would open a wave of positive bias that will be the fuel higher, in our opinion. This event driven piece of news could come in the form of a strong earnings season or a dovish shift in monetary policy but we’re thinking most likely a claim of victory from the current administration on trade policy, should concessions be reached with our trading partners.
The various sentiment indicators that we track are contrarian indicators, meaning that excessive bullishness isn’t optimal for equity investment. The AAII investor Sentiment Survey is currently showing the 10-week SMA of the bulls-to-bears ratio (the number of bulls/number of bears in the survey) at 1.39. This is slightly elevated from the 200-week SMA of 1.27, but well below what we consider extreme bullishness near 1.80.
The Wall Street Sentiment Survey measures the market opinion for a group of traders and analysts. Similar to the AAII Investors Survey, this is considered a contrarian index and we track the 10-week SMA of the ratio of bulls-to-bears. This ratio is stands at 1.85 which is higher than the 200-week SMA of 1.15 but still below the excessively bullish reading of 2.05.
The NAAIM Exposure Index provides insight into the actual adjustments active risk managers have made to client accounts over the past two weeks. The 10-week SMA of the NAAIM reads 86.8. This indicates that investment managers are weighted to the “long” side of the market but are not fully invested. This cash on the sidelines will provide fuel to the market once sentiment shifts to a bullish extreme.

The elevated VIX level confirms a bit of anxiety this year. The average VIX level in 2017 was 11.09, in 2018 it is 16.02. This added level of market nervousness is attributable to the trade overhang in our opinion and feeds into our analysis that a bit of good news will propel the SPX towards new highs for the year.

A recent tweet from @sunchartist shows that the short volatility trade is making a comeback but is still below the crowded trade from 2016 and 2017.

There are other signs of market skittishness. In a recent Bloomberg article, they note, “While benchmark measures of volatility are as calm as they’ve been in five months, among individual stocks anxiety is running high. It’s showing up in indicators that plot bearish and bullish options, in a lingering preference for defensive industries and the refusal of hedge funds to commit new money.”

“Stocks are hobbling along; options traders worry they’ll fall. The Cboe put-to-call ratio for equities, tracking volume in bearish versus bullish bets, averaged 0.6 in the 10 days through Wednesday, the highest since early May. The ProShares Ultra VIX Short-Term Futures ETF, which rises when volatility goes up, has attracted $230 million of new money this month, doubling its assets.
Most of the nervousness is being felt in individual stocks and enough industries are doing well that the effect is masked when you look at indexes, said Victor Lin, a Credit Suisse strategist. A lack of lockstep moves has been one of the market’s signature qualities for the last few months, pushing correlation to a five-month low.”
Sector Positioning
Should we see a high-volume breakout in the SPX, we will be positioning ourselves in higher-beta growth sectors and stocks over lower-beta defensive sectors and stocks. We’ve already pointed out the current leadership roles of the Nasdaq and Russell 2000 over the S&P 500 and Dow Jones Industrial Average. This action reinforces our belief that growth stocks will lead the sentiment driven rally if it should occur. We believe the current state of US yields on the long-end of the curve suggest something similar. This tweet by Dana Lyons (@JLyonsFundsMgmt) shows the iShares 20Y Treasury Bond ETF (TLT) testing its long-held trend line that has recently flipped from support to resistance.

Similar analysis from John Murphy from Stockcharts.com shows the 10Y treasury yields hitting key levels. The iShares 7-10Y Treasury Bond ETF (IEF) is hitting key resistance levels and the yield on the 10Y looks like it wants to head higher.


Higher yield on the long end of the curve favor cyclical growth stocks that benefit from economic expansion and hurt defensive stocks, especially those higher income producing equities that pay dividends. The sectors most negatively affected by this event will be Utilities, Telecom, REITS and Consumer Staples – those sectors paying the highest dividends.

The US dollar is hitting near a critical level at this stage of the cycle. Looking at the Fibonacci levels from the lows in 2014, the following chart daily US dollar index shows the 94-95 level to be very important. It represents 61.8% retracement from the 2014 lows into the 2017 highs. This level acted as key support through ’15, ’16 and ’17 and most recently has started acting as resistance for the last year. The weaker US dollar will also coincide with lower treasury yields and supports our thesis of a growth-oriented sentiment rally.
The US dollar is trying to break through his 94-95 level to the upside but appears to be struggling as both the MACD and RSI are quickly losing momentum.

The Catalyst
We tend to believe there will be a near-term “win” for the current administration as it pertains to trade policy. With mid-term elections on the horizon and very close races for control of Congress, we believe any concession, however small by our trading partners will be claimed as a major victory by the Trump administration. This should spark a sentiment rally in our opinion to drive the market higher.


Longer-Term Concerns
Over the past several weeks and months there have been a few signs that the expansion cycle is coming dangerously close to ending.
BAML has created an indicator that consists of 19 variables that they say is accurate in predicting the next bear market. According to their research (via Business Insider), “Fourteen down, five to go: That's the status update on Bank of America Merrill Lynch's signposts for the next bear market in stocks.
The latest signal was triggered by the recent outperformance of low-quality stocks — companies with the highest levels of debt and weakest profitability — over high-quality stocks, the firm said in a note to clients on Wednesday.
BAML found that relative to the rest of the market, active fund managers were the most invested in low-quality stocks. "Since we began to track large cap fund holdings in 2008, managers have been increasing their tilts towards expensive, large, low dividend yield and low quality stocks," Savita Subramanian, the head of US equity and quant strategy, said in a July 2 note.
"Their respective factor exposure relative to the S&P 500 is near its record level."”

“This was enough to tick another checkbox on BAML's bear-market list, and shifted its Bull & Bear Indicator further left into "extreme bearish" territory.”

Now before we all go out and liquidate our portfolios, we should understand that this indicator, very much like the sentiment indicators that we track is contrarian in nature. In fact, BAML has gone on to say that this indicator with its current reading leads a bear market by a full 21 months and the average return for the market was 30% higher before the peak. So, while sounding ominous and alarming, it actually plays into our near-term thesis of higher prices before the selling starts.
Below is the BAML checklist in its entirety.

Another article stressed about the increase in the unemployment rate back in May. According to research from MarketWatch, “The unemployment rate rose last month, to 4% from 3.8% in May.
That may not seem like a big deal. It’s still around the lowest unemployment rate since 2000, and June’s increase was driven by 601,000 people entering the labor force, as a good economy drew more job seekers. But in a column I wrote last year, I went back to 1948, when the Labor Department first started tracking unemployment, and showed that historically, when the unemployment rate hit its low for the cycle, a bear market and recession haven’t been far behind.
As the table from that column shows, the low unemployment rate of each business and market cycle over the past 70 years preceded a recession by 9.2 months and a bear market by 14.8 months on average.”

“I took a deeper dive into the monthly rates in the last two economic cycles and found that after the rate hit its low point for the cycle, it generally rose a bit and then bounced around near that low before heading up for good as the cycle turned and a recession and/or bear market began.”

“This shows two important things: First, even slight increases in the unemployment rate from the low can show the cycle is ending. Second, of course, you can never know when the rate has bottomed until months later.
But you can make an educated guess, which is why I say the indicator is flashing yellow.”
Global Economic Growth
The IMF has recently lowered global economic growth expectations for most developed and emerging economies. The following graphics (via ZeroHedge) shows the forecasts by the IMF that have responded to increased threats to a global trade war.


Bottom Line: We believe the US equity markets should have one more run as sentiment and animal spirits kick in. A strong earnings season or a shift in monetary policy may prove to be the catalyst, but we tend to believe the turning point will stem from fiscal policy decisions – most likely a “win” for the current administration – even if only for politically cosmetic reasons - as we head into mid-term elections. One more strong trading day with above average volume should be enough to entice us to redeploy aggressively. We intend to be fully invested and prepared to take advantage of a buying opportunity.
That said, we are very cautious as it pertains to US equity returns and the global economy once our anticipated “sugar-rush” rally finishes.
Joseph S. Kalinowski, CFA
Comments