Check back soon
Once posts are published, you’ll see them here.


We wanted to highlight several economic indicators that we track. These are used as confirmation tools with our overall investment thesis. For the most part these figures look quite strong and that is a good thing when applied to our bullish stance. That said, many are also sitting near extreme outlier territory that makes a mean-reverting contrarian squirm a bit.
Consumer Spending & Retail Sales
Given the weight of consumer spending in our economic growth figures it is worth watching. Right now, consumer spending appears robust. The latest U.S. Consumer Spending figures from the U.S. Department of Commerce shows Personal Consumption Expenditures (PCE) increased $49.3 billion or 0.4% in July. They also report that Personal income increased $54.8 billion (0.3%) and Disposable Personal Income (DPI) increased $52.5 billion (0.3%).

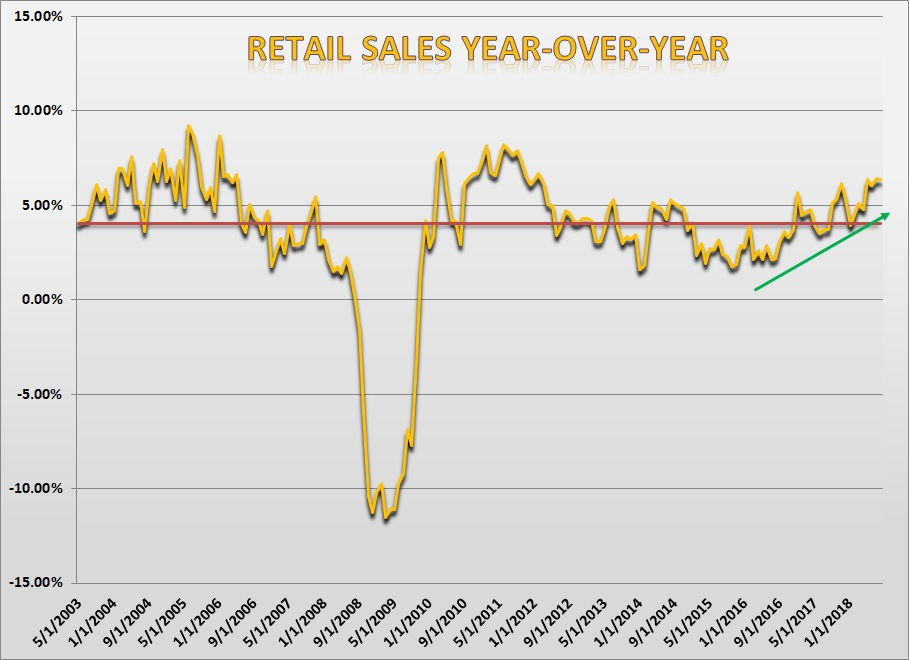
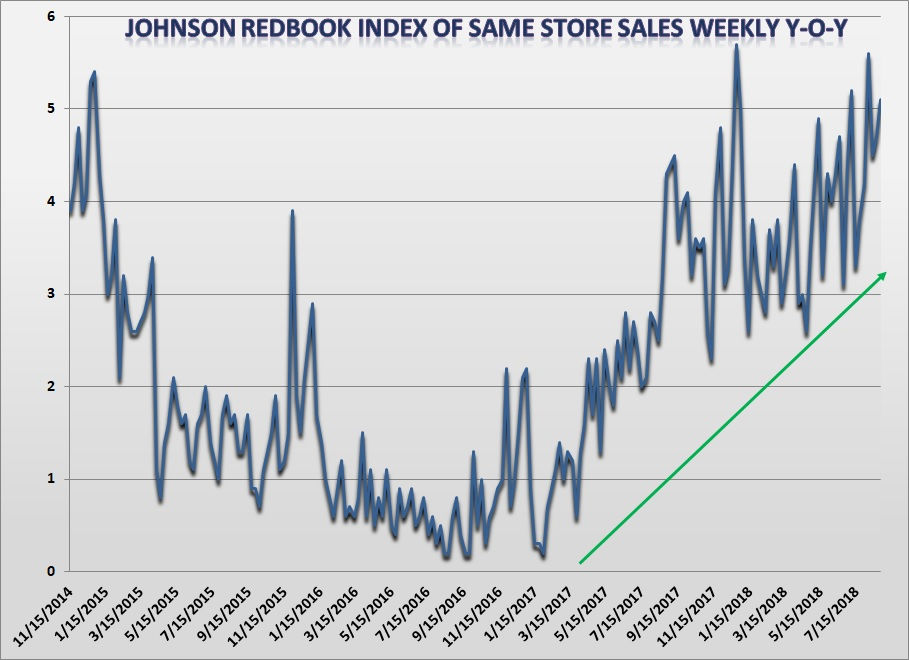
Retail sales have been in an uptrend and are still trending higher while the year-over-year growth rate in the Johnson Redbook Index of weekly same store sales continues higher.
While consumer spending may be robust overall, we came across a recent post on Wolf Street that shows credit card delinquency rates among smaller banks has risen above the levels right before the Great Recession.

He goes on to note that credit card charge-offs for smaller banks has ratcheted up to 7.8%.

Lance Roberts from Real Investment Advice points out, “The problem is when you look at the bottom 80 percent of the population versus the top 20 percent, there is no wage perk, and disposable income is absolutely nonexistent. In fact, the average household, to maintain their current standard of living, is running at almost $8,000 deficit every single year which explains why credit card growth is running at rampant paces. And just an article out just yesterday talking about the number of baby boomers now moving into retirement over the age of 65 filing bankruptcy is spiking at very fast levels.”

This is certainly not enough to make me run for cover but clearly an unusual observation within the goldilocks consumer spending scenario.
In the near-term, the consumer appears to be in good shape and that supports higher equity prices. We are keeping our intermediate bullish stance in place but understand longer-term risks remain. In a recent Forbes article by Jesse Colombo, he writes about the risks to the market given what he deems to be bubble-like household wealth readings.
In the article he observes, “The chart below compares U.S. household wealth (blue line) to the underlying economy or GDP (orange line). In sustainable, organic wealth booms, household wealth tracks GDP very closely. Starting in the late-1990s, however, household wealth decoupled from the GDP as the tech stock bubble helped to inflate American portfolios until it came crashing down in the early-2000s. In the mid-2000s, the U.S. housing bubble boosted household wealth until the 2008 housing crash. Now, here we are in 2018, and the gap between household wealth and the underlying economy has never been larger. This unprecedented gap means that the coming reversion or bust is going to be even worse than the last two, unfortunately.”

Given the current statistics it’s hard to start calling for an economic recession, but these indices are at best a coincident indicator to stock prices and we understand the situation can change quickly and dramatically. Signs of weakness should be taken seriously especially in light of a tightening Fed that may have to get quite hawkish should inflation emerge, a potential trade war on the horizon and a strengthening U.S. dollar that threatens profitability.
Small Business Optimism and Consumer Confidence
John Mauldin of Mauldin Economics makes a point that small business owners are confirming the underlying strength of the economy. He cites recent readings from the National Federation of Independent Business (NFIB) as evidence.
In his research he writes, “The NFIB data is a rich, long-term history of small business owner sentiment, both positive and negative. It has varied over time, as you might expect. Presently, their index is near its most optimistic level ever—0.1% below the 1983 all-time high. Considering where we were a few years ago, that is amazing.”

“One of the NFIB indicators is the difficulty small business owners have in filling job positions. Right now, it’s at a record high, with many owners reporting qualified worker shortages as their single greatest business challenge.”

“This is a consequence of another “good news” item: historically low unemployment. It took way too long after the last recession, but employers are finally willing to expand payrolls.”

“If, for instance, you’re a business owner and you see new conditions that will make growth easier, you will be more likely to hire, expand, and make capital investments. Get enough businesses thinking that way at the same time and you have the makings of an economic boom… which is what the leading survey of small business owners says is happening.”
The one concern I have with the NFIB data is they tend to be coincident indicators with the stock market. They are useful to trade as they are trending higher but as they start to reach peaks or troughs they could be used as contrarian indicators.
Another index that we like to track is the Sabrient Insider Sentiment Index. The Sabrient Insider Sentiment Index is an equal- dollar weighted index comprising publicly-traded companies that reflect positive sentiment among those 'insiders' closest to a company's financials & business prospects (top mgt, directors, analysts).

When looking at the year-over-year change in this index, it is much more useful in assisting trying to capture a market bottom when used as a contrarian indicator but lousy at trying to time market tops. That said, when the market resumes an uptrend, a positive sloping rate-of-change in the year-over-year Sabrient Insider Sentiment Index acts as solid confirmation that we’re on the right side of the tape.

What we find very curious about the year-over-year change when overlaid against the S&P 500 is the current divergence we are seeing. As mentioned, the model isn’t great at spotting market tops so we’re not losing sleep over this. What we are encouraged about is the fact that the model isn’t near its upper boundary extreme. A resumption higher in the Index will confirm our investment thesis that an ultimate market top and ensuing bear market are not yet in place.

If we were to look at Consumer Confidence, we see a similar picture. Consumers are feeling great about the economy and this data-series should act as confirmation towards the overall trend. But like small business sentiment, this turns into a contrarian indicator when it hits the outlier boundaries and reverses.
Charlie Bilello from Pension Partners highlighted market returns when the index reverses from extreme levels. He writes, “US Consumers are feeling pretty confident these days. A survey just released by the conference board showed the highest reading since October 2000. At a level of 133.4, consumers are more confident today than 94% of historical readings going back to 1967.”

“If you asked the average person on the street, they’d likely say that’s good news for the stock market.
Their line of thinking would go as follows: a more confident consumer –> more consumer spending –> stronger economy –> stronger stock market.
This seems rather intuitive but does the data support such a thesis? Let’s take a look…
If we separate the Consumer Confidence readings into deciles and compare the higher and lowest deciles, we find the following:
Above-average returns and a higher probability of positive returns following extremely low confidence readings (Decile 1 in the table below).
Below-average returns and a lower probability of a positive return following extremely high confidence readings (Decile 10 in the table below).”

“How is that possible? Why would there be a negative correlation between Consumer Confidence and future stock market returns?
Well, when there’s good news in the economy (high consumer confidence), investors are willing to pay a higher multiple for a given level of earnings than when there’s bad news (lower consumer confidence). That’s important when it comes to stocks because higher valuations tend to be associated with below average forward returns.”
Leading Industry Trends
We like to watch industry trends that track performance metrics related to economically cyclical sectors. Clearly the railroad and trucking industry is a solid way to measure economic activity. When stuff is being shipped by rail and road, then the economy is active and that is a positive for the stock market. As with the sentiment surveys discussed above, these economic indicators are said to be leading the economy but are at best a coincident indicator when it comes to equity prices. These indices should be used as confirmation that we are on the right side of the market but should start throwing up warning/opportunity signs when extremes are reached and start to reverse.
Scott Grannis on Calafia Beach Pundit writes, “The nations' extensive fleet of trucks has hauled almost 8% more tonnage in year ending July '18. Since just before the November 2016 election, truck tonnage is up 15%. This is powerful evidence that the physical economy is expanding, and at an impressive rate.”

Wolf Richter on Wolf Street writes, “The transportation sector is a reflection of the goods-based economy in the US. Demand has been blistering across all modes of transportation. Freight shipment volume (not pricing… we’ll get to pricing in a moment) by truck, rail, air, and barge, according to the Cass Freight Index jumped 10.6% in July compared to a year earlier. This pushed the index, which is not seasonally adjusted, to its highest level for July since 2007.”

“The Cass Shipments Index does not include shipments of bulk commodities, such as grains or chemicals. But shipments of commodities were strong too, according to the Association of American Railroads. Excluding the carload category of coal, which is facing a structural decline in the US, carloads rose by 6.7% year-over-year, including grain, up 14.7%; petroleum & petroleum products, up 27%; and chemicals, up 4.6%. Of the 20 commodity carload categories, only five showed declines, including nonmetallic minerals, metallic ores, and the biggie, coal.
And intermodal traffic – shipments of containers and trailers via a combination of rail and truck – surged 6.9% in July compared to July last year, the AAR reported.
The pop in the Cass Shipments Index of 10.6% was the sixth double-digit increase so far this year. Only June had come in with a single-digit increase (7.2%).”

“The Cass Truckload Linehaul Index, which tracks per-mile full-truckload pricing but does not include fuel or fuel surcharges and is therefore not impacted by diesel price increases, jumped 10.2% in July, the largest year-over-year increase in the data going back to 2005.”

“The Cass Intermodal Price Index, which includes fuel prices, jumped 12.0% in June compared to a year ago, the 22nd month in a row of year-over-year increases, and the sharpest year-over-year increase since July 2011.”

“In aggregate, across all modes of transportation, the amount companies spent on shipping soared by 17.9% in July compared to July last year, according to the Cass Freight Expenditures index. This surge is a function of higher prices and fuel surcharges, as well as higher shipment volumes at those higher prices.”

These are strong figures confirming a strong transportation sector but when at extremes can often be a warning. We wrote several weeks back that we believed a solid threat to the US bull market would be the emergence of stronger than expected inflation that would force the Fed to become more hawkish in their monetary policy stance (see Inflationary Concerns and a Bear Market). With a Fed that is forced to hike rates to provide price stability along with trade war risks would be enough to end the bull-run in our opinion.
Industrial Production is confirming underlying economic growth and confirmation of the bull-run. According to the latest release from the Board of Governors of the Federal Reserve System, “Industrial production edged up 0.1 percent in July after rising at an average pace of 0.5 percent over the previous five months. Manufacturing production increased 0.3 percent, the output of utilities moved down 0.5 percent, and, after posting five consecutive months of growth, the index for mining declined 0.3 percent. At 108.0 percent of its 2012 average, total industrial production was 4.2 percent higher in July than it was a year earlier.”

Year-over-year industrial production has been on the rise and is looking healthy. We’ll be watching for a sharp deterioration for signs of trouble.

The American Chemistry Counsel created the Chemical Activity Barometer (CAB). On their website they write, “American chemistry is essential to the U.S. economy. Chemistry’s early position in the supply chain gives the American Chemistry Council (ACC) the ability to identify emerging trends in the U.S. economy and specific sectors outside of, but closely linked to, the business of chemistry.
The Chemical Activity Barometer (CAB), the ACC’s first-of-its kind, leading macroeconomic indicator will highlight the peaks and troughs in the overall U.S. economy and illuminate potential trends in market sectors outside of chemistry. The barometer is a critical tool for evaluating the direction of the U.S. economy.
The index provides a longer lead (performs better) than the National Bureau of Economic Research (NBER).
The Chemical Activity Barometer is a leading economic indicator derived from a composite index of chemical industry activity. The chemical industry has been found to consistently lead the U.S. economy’s business cycle given its early position in the supply chain, and this barometer can be used to determine turning points and likely trends in the wider economy. Month-to-month movements can be volatile so a three-month moving average of the barometer is provided. This provides a more consistent and illustrative picture of national economic trends.
Applying the CAB back to 1912, it has been shown to provide a lead of two to fourteen months, with an average lead of eight months at cycle peaks as determined by the National Bureau of Economic Research. The median lead was also eight months. At business cycle troughs, the CAB leads by one to seven months, with an average lead of four months. The median lead was three months. The CAB is rebased to the average lead (in months) of an average 100 in the base year (the year 2012 was used) of a reference time series. The latter is the Federal Reserve’s Industrial Production Index.”
According to their latest release, “The Chemical Activity Barometer (CAB), a leading economic indicator created by the American Chemistry Council (ACC), was flat in August remaining at 122.14 on a three-month moving average (3MMA) basis. This continued a general softening trend since the first quarter. The barometer is up 3.8 percent year-over-year (Y/Y/), a slower pace than of that earlier in the year and similar to that seen in the second half of 2017. The unadjusted CAB also was flat and follows a 0.3 percent decline in July. August readings indicate gains in U.S. commercial and industrial activity well into the first quarter 2019, but at a slower pace as growth has turned over.”

Looking at the year-over-year change in CAB, we see it has been getting weaker over the past few months and the growth rate is below the six-month moving average. A sudden deterioration in this figure will be a recession warning.

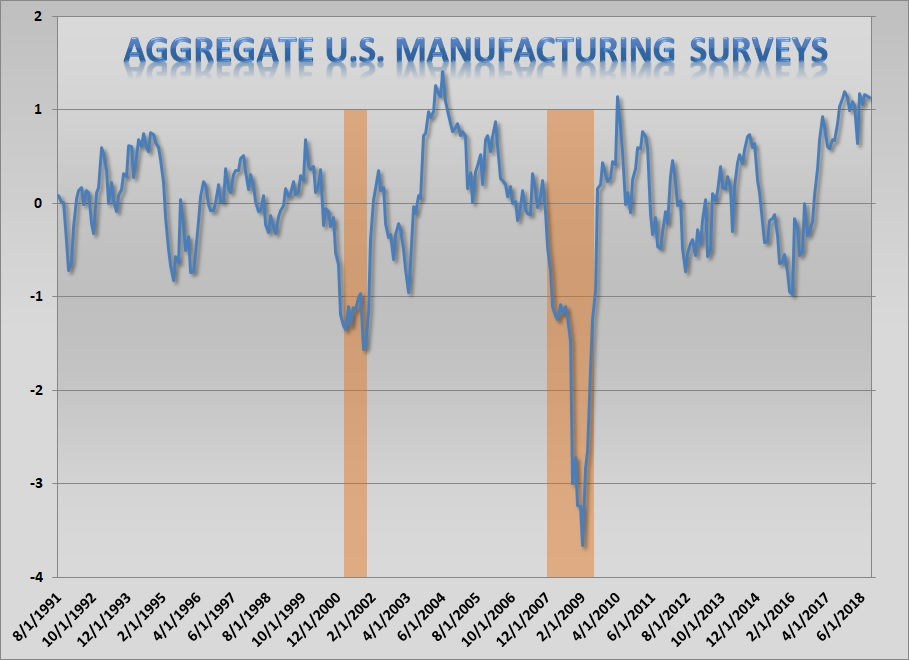
The manufacturing sector seems to be doing well. So well in fact that we seem to be hitting extreme outliers in many of the manufacturing surveys. For the purpose of convenience, we aggregate all the major manufacturing surveys into one equal weighted model. The model combines the ISM Manufacturing PMI, the Empire State Manufacturing Survey, the Philly Fed Business Outlook, the Richmond Manufacturing Survey, the Dallas Fed Manufacturing Outlook and the Chicago Fed National Activity Index. The model is trading a full standard deviation above its average. This kind of activity is healthy for the overall economy but as with any other mean reverting model, will eventually start to cool off.
We will be watching for sudden and extreme changes in the model for an indication that something is awry.
Trade Concerns
Many businesses are taking the threat of tariffs and trade policy quite seriously. In a recent blog post by the Federal Reserve Bank of Atlanta, they provided some insight on the topic. “A pressing issue at the moment is whether, and how, firms are reassessing their capital investment plans in light of recent tariff hikes and fears of more to come. By raising input costs, domestic tariff hikes undercut the business case for some investments.
They can raise domestic investment in newly protected industries. Retaliatory tariff hikes by trading partners can also affect domestic investment by curtailing the demand for U.S. exports. An uncertain outlook for trade policy can cause firms in all industries to delay investments while they wait to see how trade policy disputes unfold.
Last month's SBU (previously known as our Survey of Business Executives) sheds some light on these matters. We first posed a simple question: "Have the recently announced tariff hikes or concerns about retaliation caused your firm to reassess its capital expenditure plans?" Yes, said about one-fifth of our respondents.
As exhibit 1 shows, the share of firms reassessing their capital plans because of tariff worries is higher for goods-producing firms than service-providers. It's 30 percent for manufacturers and 28 percent in retail & wholesale trade, transportation and warehousing. In contrast, it's only 14 percent among all service providers in our sample. These sectoral patterns make sense, given that manufacturing firms, for example, are more engaged in international commerce than most service providers.”

“We also asked firms how they are reassessing their capital expenditure plans in light of tariff worries. Exhibit 2 provides information on this issue. Among firms reassessing, 67 percent have placed some of their previously planned capital expenditures for 2018–19 "under review," 31 percent have "postponed" or "dropped" previously planned expenditures, 14 percent have "accelerated" their plans, and 2 percent (one firm) added new capital expenditures for 2018–19.
Finally, we asked firms how much tariff worries affect their previously planned capital expenditures. Among firms re-assessing, an average 60 percent of their capital expenditure plans are affected. The predominant form of reassessment is placing previously planned capital expenditures "under review."”

“These findings suggest that tariff worries have had only a small negative effect on U.S. business investment to date.
Still, there are sound reasons for concern. First, 30 percent of manufacturing firms report reassessing capital expenditure plans because of tariff worries, and manufacturing is highly capital intensive. So the investment effects of trade policy frictions are concentrated in a sector that accounts for much of business investment. Second, 12 percent of the firms in our full sample report that they have placed previously planned capital expenditures under review. Third, trade policy tensions between the United States and China have only escalated since our survey went to field. The negative effects of tariff worries on U.S. business investment could easily grow.”
Housing Concerns
The one item that should be watched is the strength in the housing market. The Leading Economic Indicators released by the Conference Board show a weakening state of year-over-year growth in building permits, often considered a leading economic indicator.

According to research out of Charles Schwab, “Consumer spending and confidence remain robust, but a risk to watch is the deterioration in a number of housing indicators. New home sales fell 1.7% in July to a nine-month low after a 2.4% drop in June according to the Commerce Department; while existing home sales fell 0.7% in July according to the National Association of Realtors, to the lowest rate since February 2016.”

Research out of Wolf Street shows, “In July, pending home sales fell 2.5% from a year ago, according to the National Association of Realtors this morning. It was the worst July in years.
This chart shows the trend of pending home sales going back through 2015, which each July marked. Note the peak of the sales enthusiasm: April 2015, when the index hit highs not seen since before “Housing Bubble 1” collapsed.”

“The index, based on a national sample of the transactions handled by the NAR’s members, is a leading indicator for actual sales. It tracks sales of existing homes, but not of new homes. A sale is listed as “pending” when the contract is signed but before the transaction closes, which usually happens within a month or two. Not all deals that are signed close.
The Pending Home Sales Index fell in all four regions, compared to July last year, but note the plunge in the West, fertile breeding ground for some of the most ludicrously overpriced markets in the US:
Northeast: -2.3%
Midwest: -1.5%
South: -0.9%
West: -5.8%.”
We also found this item in our readings. From MarketWatch, “The “Sound Advice Risk Indicator” is a different story. This indicator, the brainchild of Gray Cardiff, editor of the Sound Advice newsletter, is derived from the ratio of the S&P 500 SPX, -0.53% to the median price of a new U.S. house. For the first time since the late 1990s, and for only the sixth time since 1895, this indicator has risen above the 2.0 level that represents a major sell signal for equities. (See accompanying chart.)”

Economic Profile
The Atlanta Fed GDPNow is forecasting 4.7% economic growth for the third quarter. “The GDPNow model estimate for real GDP growth (seasonally adjusted annual rate) in the third quarter of 2018 is 4.7 percent on September 4, up from 4.1 percent on August 30. The nowcasts of third-quarter real consumer spending growth and third-quarter real private fixed investment growth increased from 3.0 percent and 3.0 percent, respectively, to 3.6 percent and 4.3 percent, respectively, after this morning's construction spending report from the U.S. Census Bureau and this morning's Manufacturing ISM Report On Business from the Institute for Supply Management. The model's estimate of the dynamic factor for August—normalized to have mean 0 and standard deviation 1 and used to forecast the yet-to-be released monthly GDP source data—increased from 0.18 to 1.14 after the ISM report this morning.”

The economic summary found on The Capital Spectator says, “Whatever’s in store for Q3 and beyond, this much is clear: US economic activity has been healthy to date. The Capital Spectator continues to estimate a virtually nil probability that a new NBER-defined downturn started in July, based on a diversified set of economic indicators. (For a more comprehensive review of the macro trend with weekly updates, see The US Business Cycle Risk Report.)”

“Aggregating the data in the table above continues to indicate a strong positive trend overall. The Economic Trend and Momentum indices (ETI and EMI, respectively) remain well above their respective danger zones (50% for ETI and 0% for EMI). When/if the indexes fall below those tipping points, the declines will mark overt warning signs that recession risk is elevated and a new downturn is imminent. The analysis is based on a methodology that’s profiled in my book on monitoring the business cycle.”

Economic Warning Signs
Cam Hui, the author of Humble Student of the Markets provides truly brilliant insight on global markets and the economy. His calls have been very accurate in the past so when he says there are things that keep him up at night, any investor should definitely take heed.
He writes, “The latest Fathom Consulting forecast shows recession risk is rising dramatically.”

“A more worrisome monetary indicator is the deceleration in money supply growth. In the past, real year/year money supply growth, measured as either M1 or M2, has turned negative ahead of recessions. While the weekly data series is noisy, real M1 growth fell negative last week, and while real M2 growth remains positive, it is decelerating and on track to turn negative in the near future.”

Technical Analysis
So we are watching the economic activity listed above as well as the yield curve and inflation. Most of these indicators, while being leading economic indicators are coincident indicators when it comes to the stock market. We use these indicators as a confirmation that we are on the right side of the market. There were many, many economists at the start of 2008 that we forecasting rosy times ahead and completely missed the call on the Great Recession.
The US equity markets will give us the signals we need to change our stance. On the monthly chart for the S&P 500 we will need to see a bearish cross of the MACD line through the signal line for our first warning. A breach below 50 on the RSI and a break below the 20-month SMA will act as further evidence that things are not right. If the slope of the 20-month SMA goes negative and prices test the 20-month SMA and 50 on the RSI as resistance and fail, we will use that as our signal to change our stance. At that point we will seek confirmation from the economic indicators that we are correct in our investment thesis.

For the time being, we are bearish tactically and raising cash for the next several weeks. From that point we will seek a bottoming process in the market and throttle up into the close of the year. We are giving the bull market and the economy the benefit of the doubt and haven’t altered or bullish stance…yet.
Joseph S. Kalinowski, CFA
Comments