Check back soon
Once posts are published, you’ll see them here.


We have stated our concerns about the potential rise of inflation and its effect on the market (read Inflationary Concerns and a Bear Market). We thought it was time to update our notes on the topic.
Monetary policy action on the part of the Fed has greatly influenced economic trajectory in the past. Lance Roberts from Real Investment Advice points out, “In the U.S., the Federal Reserve has been the catalyst behind every preceding financial event since they became “active,” monetarily policy-wise, in the late 70’s. As shown in the chart below, when the Fed has lifted the short-term lending rates to a level higher than the 10-year rate, bad “stuff” has historically followed.”
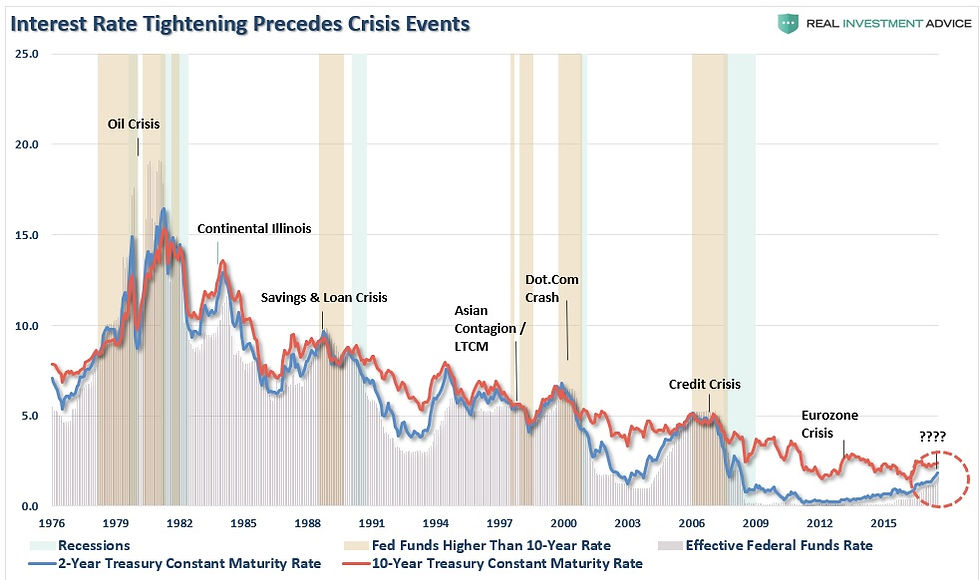
As of the time of this writing, the market is placing 97.9% odds that the effective fed funds rate will reside between 2.0% and 2.25% at the end of the September Fed meeting and 76.3% probability that it will rise to 2.25% to 2.50% by the end of December. Looking out to the end of the first quarter in 2019, fed funds futures place a 45.7% probability that the fed funds effective rate will be north of 2.50%.

Should inflationary pressures start to creep into the current economic cycle, the Fed may be forced to get increasingly hawkish, possibly inverting the yield curve, as measured by the 10-year and 2-year. That could be a catalyst to end the current bull-run that started at the end of the Great Recession. We’re seeing inflation make its way into the late stages of our economic growth cycle as core PCE, CPI and PPI have been heading higher.

We also note that the 10-year TIPS yield in on the rise.

Cam Hui from Humble Student of the Markets also noted, “The Fed’s own favorite inflation metric, core PCE, is also showing sufficient inflation pressures for a steady upward march in interest rates. In the past, whenever the trailing 12-month count of annualized monthly core PCE above 2% has exceeded six or more, the Fed has embarked on a monetary tightening program. The only exceptions occurred in 2008, which was the onset of the GFC, and 2011, the Greek Crisis.”

Currently we haven’t been seeing inflation readings running ahead of forecasts as is typical prior to a recession. In fact, the monthly Citi U.S. Inflation Surprise index has been negative dating back about six years with a small positive blip from time to time. What we have been seeing though, is the average negative surprise getting smaller as the index has been creeping higher for the better part of two years. The narrowing of the forecasted-to-actual results is a trend that precedes difficult market environments.

Cam Hui from Humble Student of the Markets astutely pointed out that the U.S. Citi inflation readings are a global anomaly. Everywhere outside the U.S. is already seeing inflation running ahead of expectations according to the Citi indices.

If you’re a proponent of push-cost inflation, where overall price levels go up partly due to increases in the cost of wages, then the NFIB Small Business Compensation Plans Index is also signaling higher potential inflation on the horizon.

This is confirmed by increases in the BEA Employment Cost Index as well.

More insight from Humble Student of the Markets, “The Atlanta Fed’s Wage Growth Tracker also reveals another dynamic of wage inflation that is not fully captured by some statistical measures. Job switchers have been able to extract higher wage growth because of the tight labor market.”

We have pointed out in previous writings that our aggregate measure of U.S. manufacturing appears over-extended but healthy. In our post Remaining in the Longer-Term Bullish Camp for Now we wrote, “The manufacturing sector seems to be doing well. So well in fact that we seem to be hitting extreme outliers in many of the manufacturing surveys. For the purpose of convenience, we aggregate all the major manufacturing surveys into one equal weighted model. The model combines the ISM Manufacturing PMI, the Empire State Manufacturing Survey, the Philly Fed Business Outlook, the Richmond Manufacturing Survey, the Dallas Fed Manufacturing Outlook and the Chicago Fed National Activity Index. The model is trading a full standard deviation above its average. This kind of activity is healthy for the overall economy but as with any other mean reverting model, will eventually start to cool off.
We will be watching for sudden and extreme changes in the model for an indication that something is awry.”

The analysts at MERK Research released their August 2018 U.S. Inflation Chart Book. In it they state, “The Manufacturing ISM (which is an economic growth leading indicator) appears to be a longer leading indicator for inflation…it potentially suggests that inflation might peak late next year.”

Darrell Spence and Jared Franz signaled some inflationary apprehension in research posted on Capital Ideas. In it they write, “Spence says given the health of companies, increased pricing power and the strength of the economy, attention must be paid to inflation.
“If there’s something the markets might start to pay a lot more attention to in the second half of 2018, it’s whether or not it’s appropriate to have a relatively sanguine inflation outlook,” Spence says. Core inflation — the measure that strips out volatile energy and food prices — was at 2.2% in May. Including food and energy, inflation hit 2.8% in May.
One of the most reliable indicators of impending inflation is resource utilization. The higher the utilization rate, the less slack in the economy and the greater the potential inflationary pressure. The utilization rate blends measures of manufacturing activity and employment, so this kind of relationship seems intuitive.”

Indeed, it is our opinion that the Fed has been getting increasing hawkish. In a recent Bloomberg opinion piece, they state, “The chart below shows the percentage of official Fed communications — speeches, testimonies and statements — by topic since the mid-1990s. Inflation concerns and hawkish rhetoric make up well more than half the talk, and are crowding out dovish comments and global and financial-stability concerns.”

“Zeroing in on inflation, Fed Chairman Jerome Powell and his fellow policy makers at the central bank have talked more about inflation in 2018 than any other post-crisis year. A good example is Chicago Fed President Charles Evans, a longtime monetary dove, who has shocked Fed watchers by putting on his seldom-used hawk talons. Evans suggested the Federal Open Market Committee may need to raise rates to “somewhat restrictive” levels to combat anticipated inflation.”

“To illustrate how Fed talk is running ahead of market expectations, the chart below uses the central bank’s own words to estimate the number of rate hikes expected over a 12-month period. We modeled the number of rate hikes synonymous with Fed rhetoric from 1996 through 2007, and then projected it starting in 2008. The blue line provides a market-based expectation for rate hikes over the next 12 months taken from the futures market. The spread between market and Fed expectations for rate hikes is shown in the bottom panel. Values below zero show periods when Fed talk is more hawkish than market pricing.”

“This spread between Fed rhetoric and market expectations is also shown in blue in the chart below. It is compared to U.S. 10-year Treasury note yields. Periods of the Fed being more hawkish than markets have coincided with declining yields. Conversely, when the Fed is less hawkish than the market — positive blue line — yields have risen. However, this circumstance has been infrequent in the post-crisis period, which we believe has contributed to the inability of 10-year yields to break out to the upside. Fed rhetoric is giving bond vigilantes a reason to drive yields higher.”

Additional evidence of a potentially inflationary period comes from Knowledge Leaders Capital. They write, “The output gap is the difference between actual economic growth and longer-term potential growth of an economy. A positive output gap, like we have now, indicates the economy is growing faster than can be sustained without inducing pricing and wage pressures. The output gap leads wage growth by about six quarters and suggests wage growth in the mid-3% range in the near future.”

“The Job Openings and Labor Turnover Survey (JOLTS) has sub-components that include the number of people quitting a job voluntarily and the total number of separations (voluntary quits plus terminations). It stands to reason that as the percent of voluntary quits as a percent of total separations rises, wages should also rise, since people generally only leave their current job for a better paying job. And indeed that is the case when we compare wages to the quits to separations ratio. In fact, the quits to separations ratio leads wage growth by about a year and it currently suggests we are in for another year of upward wage pressure.”

“The employment to population ratio is not only low compared to history, but it is rising steadily. While it’s unlikely that the employment to population ratio will reach previous cycle heights due to structural factors (financial crisis, opioid crisis, the AI revolution), it does not look to be peaking. That is good news for wage growth, since employers are becoming less able to pull from those out of the labor force to fill open positions.”

The implications of Fed action to ward off pricing instability will become a major topic in the months to come in our opinion. In the latest Crescat Capital investor letter, they played out a very ominous scenario should the Fed need to combat the bursting of an asset bubble in an inflationary environment. They write, “The Fed’s unconventional monetary policies (money printing) since the Global Financial Crisis were successful in fighting deflation in the last economic cycle. The problem is that the Fed’s accommodation has led to record financial asset inflation. The Fed has already proven that money printing can counter deflationary pressures in the real economy. We strongly believe that the idea of needing to fight deflation today is same idea as “fighting the last war” because it ignores all the signs that we are presenting herein that we are in a rising inflationary environment now. If the Fed were to panic and print money in a financial asset bubble meltdown and inflationary environment like today, it could lead to a disaster such as the 1973-74 bear market where money printing would feed a vicious cycle of rising money velocity, sharply rising inflation, loss of confidence in central banks, and further financial asset bubble meltdown.
Per Crescat’s model, the neutral Fed funds rate that would be necessary to control rising inflationary pressures today is 5.5%. The current Fed funds rate, however, is only 2%. Our research is based on the history of a breadth of inflation and labor market indicators and the Fed Funds rate going back to 1971. Please see our model in the chart below.”

“Based on our model, the period that we are in today most closely resembles the circled periods in red, the inflationary 1970s, also the housing bubble period in mid-2000. Indeed, those were periods when we had rising inflation because the Fed kept rates too far below the neutral rate. When the Fed keeps interest rates too low for too long, it creates financial asset bubbles that it has difficulty extricating itself from. It also creates real-economy inflationary pressures.”
Tariffs are Inflationary
The simulative fiscal policy measures taken by the Trump Administration, (corporate tax cuts and deregulation) are good things for the economy but are inflationary. While we find it unique to implement such policies in our current economic cycle, we applaud such actions (although some thought on spending would have made these actions even better). The course of action on trade policy is much more dubious in our view. We have written in the past about our negative take on tariffs and ultimately trade wars (see Thoughts on Trade Policy).
Tariffs act as a tax on U.S. consumers and thus add to our inflationary concerns. According to an article in the New York Times, “In 2009, American tire makers persuaded the Obama administration to impose tariffs on Chinese tires, and imports of tires from China fell sharply…One study of the Obama tire tariffs found in a single year, 2011, Americans spent an extra $1.1 billion on tires as a result of a tariff that preserved, at most, 1,200 jobs. That is almost $1 million per job, for jobs paying an average of about $40,000.”
Additionally they point out, “Steel tariffs imposed in 2002 by President George W. Bush yielded similar results, penalizing not just consumers but companies that use steel to make other products, like construction companies and carmakers. The Dartmouth economist Douglas Irwin estimated 140,000 American workers make steel, while 6.5 million workers make products that include steel.”
Price of Oil
The price for a barrel of oil is on the rise.

According to a working paper out of the International Monetary Fund, “We study the impact of fluctuations in global oil prices on domestic inflation using an unbalanced panel of 72 advanced and developing economies over the period from 1970 to 2015. We find that a 10 percent increase in global oil inflation increases, on average, domestic inflation by about 0.4 percentage point on impact, with the effect vanishing after two years and being similar between advanced and developing economies. We also find that the effect is asymmetric, with positive oil price shocks having a larger effect than negative ones. The impact of oil price shocks, however, has declined over time due in large part to a better conduct of monetary policy. We further examine the transmission channels of oil price shocks on domestic inflation during the recent decades, by making use of a monthly dataset from 2000 to 2015. The results suggest that the share of transport in the CPI basket and energy subsidies are the most robust factors in explaining cross-country variations in the effects of oil price shocks during this period.”


Rising inflationary concerns within the U.S. economy and the Fed’s hawkish reaction to such events places considerable risks to market multiples. One can easily argue that the U.S. stock market is expensive by historical standards.
Looking at the chart below from Real Investment Advice, we find the forward 10-year expected return for the market to be below average based on various valuation methods (Mkt Cap to GDP, Tobin’s Q and Shiller’s CAPE).

A rise in inflation would have a negative effect on current market multiples. As is seen in the chart below, there is an inverse relationship between inflation and the trailing 12-month P/E ratio for the S&P 500. We’re near 21x trailing 12-month eps currently. A rise of inflation to 4% could potentially bring that multiple down to 12x to 13x. All things held constant, that equates to a 40% decline in the index. That’s not to say we’re heading to those levels, but it’s a frame of reference based on averages.

A few things to watch.
Joseph S. Kalinowski, CFA
Comments