Check back soon
Once posts are published, you’ll see them here.


There has been increasing prognostications about the possibility of an economic recession hitting the US economy in the next year or two. The stock market should be viewed as a key leading indicator of such possible outcomes and certainly the recent market action could be viewed with a weary eye towards a topping process.
We continue to remain in the bullish camp (see Remaining in the Longer-Term Bullish Camp for Now) and believe the US equity markets are more reflective of geopolitical questions rather than economic concerns. This can be seen by the erratic moves upon breaking news stories regarding the US/China relationship. In fact, as I write this blog post, the breaking news of the day is the Chinese approval of the Disney/Fox deal. Prior to the announcement, stocks were in a free-fall and now appear to be moving aggressively higher from the lows of the day. We believe any deal resolution or breakthrough between the US and China will propel the US stock market vigorously higher.
That said, we are watching closely the possibility of geopolitical uncertainty transitioning into an economic problem. We are seeing cracks in other global economies. The Japanese economy continues to struggle. From the Japan Times, “On a quarter-to-quarter basis, GDP shrank by 0.3 percent, the second contraction of the year. Third-quarter economic activity was dragged down across important sectors of the economy, including the once consistently reliable export sector, which fell sharply by 1.8 percent.
Business investment, meanwhile, dipped by 0.2 percent on a quarterly basis, after showing strong positive growth of over 0.7 percent through the past four quarters.”
Policy makers in Japan have largely blamed natural disasters in the country for the economic slump.
In Germany, things appear to be slowing as well. In Bloomberg, “The German economy shrank for the first time since early 2015 after the auto industry took a hit.
The 0.2 percent contraction in the third quarter was worse than expected and the biggest in more than five years. While the hope is that the setback is related largely to new emissions tests that temporarily disrupted car production, the data are likely to feed into fears that the euro area’s expansion is running into trouble.”

The German DAX, Japanese Nikkei and the US S&P 500 have all fallen at least 10% from their highs and if a global recession takes place, it is our opinion that there will be further downside for the global markets into bear market territory.
Is this a correction or the start of a bear market – Yield Analysis.
An inversion of the yield curve (10y vs. 2Y) would be a key influence on our investment policy stance. The spread differential currently sits near 27bp. If the Fed determines the need to raise short-term continues, there is a high likelihood that inversion will take place.

To monitor the Fed’s progress, we also look at the yield spread differential between five-year TIPS and the Fed Funds Effective rate. A spread of -200 bp will certainly raise the red flag for us as it will send the signal that the Fed is unwilling or unable to reverse policy that may have gotten too tight.

While Chairman Powell and Co. at the Fed don’t seem to be overly concerned about a traditional inverted yield curve, it does appear over the past weekend that they may start tapping the monetary breaks a bit more gently. From MarketWatch, “He {Chairman Powell} said, however, that the Fed is at a point where it has to take risks from moving either too quickly or too slowly “seriously,” and he did identify risks to the economic outlook. Twice he noted that the global economy was slowing, which Powell called “concerning.”
Waning fiscal stimulus and the lagged effect of the Fed’s previous rate hikes are also concerns for Powell.
The slowing housing industry — which Powell pointed out is not simply about rates but also a scarcity of lots and labor — was also mentioned. Powell noted that many Americans have never lived in an environment of high mortgage rates.”
If we look at Moody’s high yield vs. investment grade spreads, when this gets above 100bp it usually signals troubling times ahead. We have recently hit 100bp although it’s difficult to say how much of an impact the GE disaster and the fallout in oil prices (small cap energy companies have an influence on high yield debt readings) are having on this spread.

From CNBC, “Total corporate debt has swelled from nearly $4.9 trillion in 2007 as the Great Recession was just starting to break out to nearly $9.1 trillion halfway through 2018, quietly surging 86 percent, according to Securities Industry and Financial Markets Association data. Other than a few hiccups and some fairly substantial turbulence in the energy sector in late-2015 and 2016, the market has performed well.”
“Essentially, the situation can break in two ways: a good-news case where companies can manage their debt as the economy stabilizes and interest rates stay in check, and the other where the economy decelerates, rates keep heading up and it’s no longer so easy to keep rolling that debt over.”
The percent of global yield curves that are inverted stands at 97.2%. This tracks the condition of the global economy and any reading below 90% should raise eyebrows.

We are approaching important warning markers but yield differentials have yet to fully signal a recession is on the horizon.
Is this a correction or the start of a bear market – Technicals.
The S&P 500 monthly chart below is the chart I use to gauge what the market is trying to say.
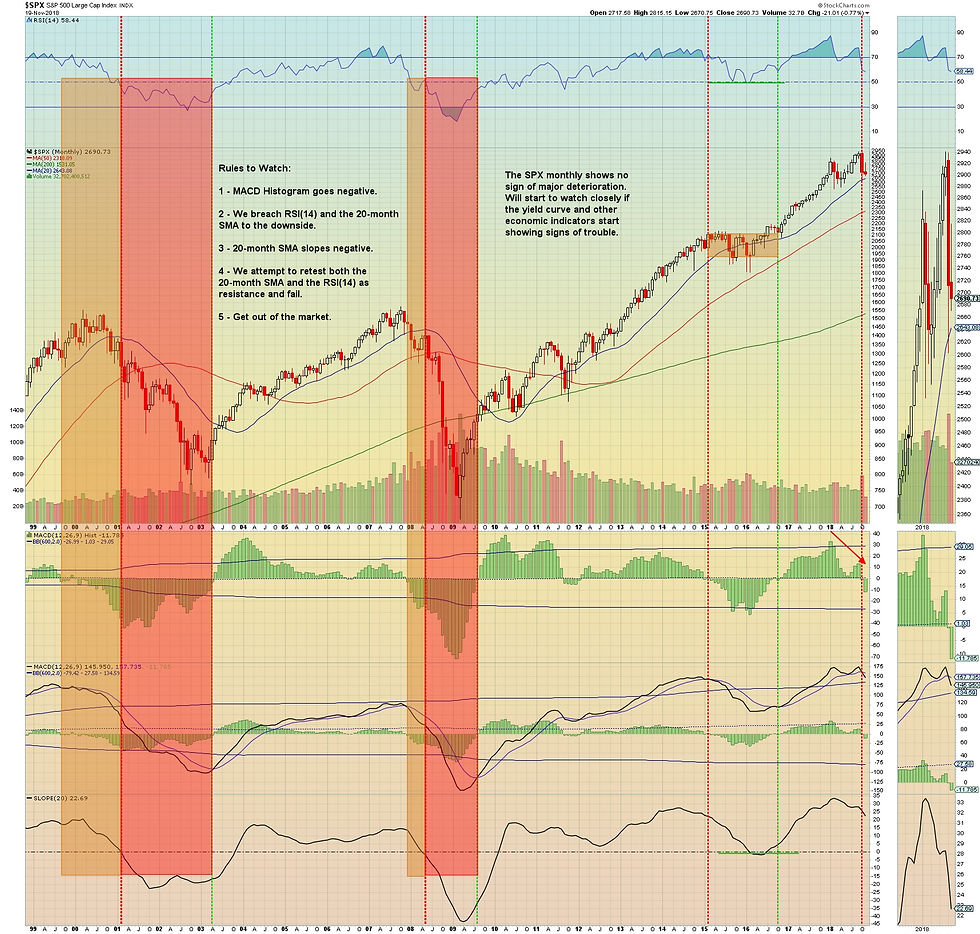
The rules I follow are as follows. The first warning comes when the monthly MACD line (12,24,9) falls below the signal line. That occurred in October. The next warning signal will occur if the monthly RSI (14) falls below 50 and stock prices pierce the 20-month moving average to the downside. If that were to occur, we would look for the retest of the RSI (14) 50 and the 20-month SMA to see if it acts as new resistance. That would most likely coincide with the slope of the 20-month SMA going negative. If that test fails, we prepare for additional downside and a bear market.
We are getting early warning signs from the market technicals. We are on alert for a possible topping process.
Is this a correction or the start of a bear market – Economic Data.
The four-week moving average for unemployment claims are near generational lows.

We will be on high alert when the year-over-year change increases by 10% of the lows. The following charts depicts in yellow the instances when it has risen 10% YOY highlighted against the S&P 500. We are not getting warning signals just yet.

The latest numbers from the Conference Board’s Leading Economic Indicators are not signaling trouble just yet.
The chart below shows the number of months since the LEI Index hit a new high. When six months go by without a new high in the index it raises red flags. The latest reading was a new high so the count currently is zero. On average, this index tends to fall 13 months prior to a recession.

The year-over-year rate of change in the index is 5.9%. When it drops 2% or more YOY we get concerned. We’re not at that level yet.

When the six-month moving average of the LEI Index drops below 0%, then we’ll need to move quickly to offset recessionary pressures.

If we take the ratio of the Conference Board’s Leading Economic Indicator Index to that of their Coincident Composite Indicator, the six-month rate of change needs to go negative before we go on recession watch. The latest reading is 1.5% so we haven’t gotten the signal yet.

The chart below shows the number of months since the LEI/COI ratio hit a new high. When twenty months go by without a new high in the index it raises red flags. The latest reading indicates we are just one month from the previous high in the ratio. On average, this index tends to fall 29 months prior to a recession.

We haven’t gotten any warnings from the economic data that we track to indicate a recession is on the horizon.
Is this a correction or the start of a bear market – Corporate Earnings.
To be clear, corporate earnings forecasts are a lagging indicator. When I hear market professionals say that they don’t see a recession on the horizon because corporate earnings estimates are growing year-over-year and estimates are being revised higher I think about driving a car using just your rear-view mirrors. Recessions will be reflected in corporate earnings estimates well after the recession sets in and certainly well after the damage has been done to equity prices.
That said there is some usefulness in watching how companies guide for future quarters out and watching a second derivative rate of change in corporate earnings forecasts to assist in building a recession watch point of view.
According to FactSet, “Companies in the S&P 500 that reported positive earnings surprises for Q3 have seen a decrease in price of 1.5% on average from two days before the company reported actual results through two days after the company reported actual results. Over the past five years, companies in the S&P 500 that have reported positive earnings surprises have witnessed a 1.0% increase in price on average during this four-day window.
If the final percentage for the quarter is -1.5%, it will mark the largest average price decline over this 4-day window for S&P 500 companies reporting positive EPS surprises since Q2 2011 (-2.1%).”

This can be confirmed from the Business Insider research note, “Stocks typically rally during earnings season because traders see proof of profit growth and the potential for future earnings. Also, companies resume repurchases of their own stock, which helps boost their earnings.
But since the start of the third-quarter season, stocks have fallen 1.7%, according to Binky Chadha, Deutsche Bank's chief global strategist. If this trend holds, Q3 would be only the third season with negative returns in the past five years, he said in a note.”

From Business Insider, Savita Subramanian, BAML's head of US equity and quant strategy noted, “There have been four quarters since the second quarter of 2017 in which companies that beat Wall Street's expectations were rewarded the next day with a share-price rally of less than 1 percentage point, Subramanian added.
But this is the first quarter since 2000 in which companies that beat on earnings are seeing a negative reaction in the stock market.”

“One of these themes is forward guidance on the impact of US tariffs on Chinese goods, which now apply to $250 billion worth of imports — about half of all that is brought in from the country. Caterpillar said it expected cost cuts to offset the higher prices caused by tariffs, but investors are skeptical.
Another overarching theme on investors' minds is that earnings growth may peak this quarter.
Subramanian cautioned clients not to confuse that with peaking profits. She noted that returns in the three and six months after a peak in earnings growth were still positive and close to average.
And so, perhaps the emergence of this trend should not be taken as a sell-all trigger. Still, it may be another reason to start positioning for the next bear market in earnest.”
In a recent Business Insider report, “in October, US stocks fully joined a global sell-off that's now on pace to erase nearly $8 trillion in market cap, the biggest monthly decline since the 2008 financial crisis, according to Bloomberg data.
It certainly seems that investors who were once quick to praise the merits of one of Trump's signature policies (tax reform) have started focusing more on the risks from another (tariffs).
This is apparent in the outlook for 2019 earnings, which have seen trade shift from a dormant concern to a prominent one.
"We estimate that an all-out US-China trade war (25% tariff on US-China trade) would reduce S&P 500 earnings ~3%," Barclays' Ajay Rajadhyaksha said in a recent note. "One potential reason why the market was sanguine about trade wars was that this is not a meaningful fraction of 2018 earnings growth, which is estimated to be greater than 20%."
Rajadhyaksha said he expects less than 10% growth next year.”

In Business Insider, “This is another situation in which there's really nowhere to go but down. The 25.5% earnings growth enjoyed by S&P 500 stocks in the second quarter was the peak, Deluard said.
Analysts expect profit growth to slow all the way to 10% next year — and even that figure is quite generous, he said. Considering earnings expansion has been the foremost driver of equity gains throughout the nearly 10-year bull market, this trend reversal is troubling.
Further, Deluard warns that analysts are behind the eight ball and will need to revise their 2019 estimates lower at some point.”

From another Business Insider report, “Goldman Sachs is specifically focused on three forces it says are putting serious pressure on profit margins: (1) increased tariffs, (2) a tight labor market featuring low unemployment and accelerating wage growth, and (3) rising debt costs — which are largely due to Federal Reserve interest rate hikes.
Goldman has been paying close attention to corporate earnings calls, and those are the three headwinds that keep popping up.
As such, investors are no longer rewarding companies that beat near-term profit forecasts. They're instead more worried about what the future holds, and how the inevitable worsening of those three factors will play out in the market.
This chart shows the recent worsening of corporate margins pressures as the labor market has tightened. As costs have risen, firms have largely been unable to offset that with price hikes — at least up to this point.”

Taking a look at the z-score for the one-year slope of 12MF earnings estimates, the corporate tax cuts started an acceleration of corporate earnings expectations above two standard deviations from the norm. After the latest earnings season, we are definitely seeing a deceleration, albeit still positive outlook for corporate earnings. That said, even a deceleration in corporate earnings estimates will bring about a weaker market environment.

Corporate earnings are decelerating but are still sloped positively. We’ll be on higher alert should the slope z-score falls below zero.
We are heading into 2019 watching for clues of an economic recession. We don’t have red flag indications yet so we are going to continue with our current strategy of long-biased growth swing trading and GARP core value investing.
We are watching yield spreads, market action and selected economic data for signs of the next bear market. We have enough “yellow flag” warnings at this point to start to plan this assumption into our investment thesis for 2019 if necessary. If these signals deteriorate and geopolitical risks start to transition into economic risks – then next year we will utilize long and short positioning within the swing trade portfolio. We will also embrace a low/beta – high dividend yielding collared strategy and take a generally risk-off approach towards the portfolio. We will need to adjust with market variables to attempt to maintain our stated investment objectives and portfolio metrics.
Happy Thanksgiving
Joseph S. Kalinowski, CFA
Comments