Check back soon
Once posts are published, you’ll see them here.


This week we are discussing an example from our work activities that uses a measure of central tendency and why knowing the standard deviation helps us interpret the data.
I love to trade stocks and I use a system of trading that utilizes both mean and standard deviation to make investment decisions.
I’ll explain how I interpret and (hopefully) profit from the use of mean and standard deviation. The method I utilize is called Standardized Unanticipated Earnings (SUE). Through a successful implementation of this concept, I attempt to capture something called Post-Earnings Announcement Drift.
Let’s say we have two companies (Company A and Company B) that are expected to report their quarterly earnings in the coming week. Both companies have similar market cap and sector bias. Both are expected to report $1.00 per share based upon the average (mean) consensus forecast. Both companies report their quarterly results and it turns out that both companies report $1.20 per share, beating forecasts by 20%.
By simply utilizing the mean, it would appear that these companies beat by the same amount and the report should be interpreted by the market in a similar fashion. But upon further review, the stock price for company A has gone up 3% the day after the report but the stock price for company B is down 5%. Here is one possible explanation.
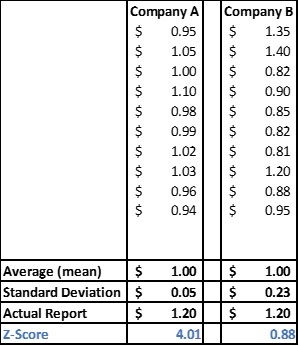
Look at the following table. These are the estimates used to derive the mean of $1.00.

Now upon further review we will calculate the standard deviation for the two companies.

So, what we find is that the analyst community was expecting, with 68.27% confidence in a normally distributed array that company A would report between $0.95 and $1.05. For company B, the expected one standard deviation range was $0.77 to $1.23.
If you apply the z-score to the results, we find that company A reported quarterly numbers 4 standard deviations from the mean while company B is less than 1. So, the $1.20 report by company A is much more meaningful than the report by company B even though they both beat their quarterly forecasts by 20%.
There have been many studies about an anomaly called Post Earnings Announcement Drift. This states that companies that produce significant quarterly earnings as measured by SUE (described above) tend to outperform the market over the subsequent 3- and 6-month period after the earnings announcement.

On May 6 of 2020, Shopify (SHOP) reported earnings with a SUE score above 2.0 (labeled 1 on the stock chart). I don’t buy it immediately but instead wait for the moving average convergence divergence histogram to fall (this is simply the difference between 12-day and 26-day exponential average of the stock price). Once it falls and then starts to head higher again, I will purchase the stock. In this case I bought on May 20 at $779.50 (labeled 2 on the stock chart).
To date there has been +34% move in the stock price in about six weeks.
Granted not all the ideas work out as nicely as this one did (cherry-picking to make a point), but the strategy has provided me with above average returns when compared to several benchmarks.
Just another way to use both mean and standard deviation jointly to be productive with data, in my opinion.
Joseph S. Kalinowski, CFA
Thanks for listening.
Comments