Check back soon
Once posts are published, you’ll see them here.


On July 23 we noted the cup-and-handle breakout within the S&P 500 and believed this momentum would carry the market to greater heights (Fear of Missing Out (FOMO)). We successfully capitalized on the move as the S&P 500 went on to make a new ATH.

But the rally has been somewhat muted. Perhaps it is a function of low summer volume. We’ll be watching for clues upon the return of traders and investors upon their autumn arrival. Our near-term tactical plan for the remainder of the year is to raise cash over the next four to eight weeks, getting through the seasonally challenging Sept. and Oct. months and redeploy assets into the end of the year.
A few weeks ago we mentioned that we were taking profits (Seven Reasons To Fade This Rally). We just wanted to touch on a few items that we think confirm our position.
As we had mentioned, the markets have gone on to rally to new highs, but the run seemed “low energy”. Willie Delwiche wrote in See It Market, “Stock Market breadth and momentum moving in the right direction as stocks move to new highs. Even with improvements, breadth is following price higher, not leading. The lack of a breadth thrust does not preclude a continued rally, though the emergence of one would be a positive development from a breadth perspective.”


He also notes that investor sentiment is getting a bit frothy. “The rally back to new highs for stocks has brought in increased optimism from investors. Bulls on the Investors Intelligence data are climbing toward their January peak and the NAAIM exposure index is at its second-highest level of 2018 (eclipsed only by a short-lived surge in June). Even the bulls on the AAII survey, which have been more restrained than the other indicators of optimism, are moving higher. That all three of these surveys are moving toward excessive optimism in unity is worth noting. Further, sentiment has a tendency to peak before price, so these indicators may not need to reclaim their previous highs to suggest that risks have risen from a sentiment perspective.”

When looking at underlying breadth thrusts for the market, the recent run from the 2018 lows has not been a high energy rally. Mr. Delwiche notes, “One of the more powerful indicators from a market breadth perspective is the emergence of breadth thrusts (as defined by the ratio of advancing stocks to declining stocks exceeding 1.9 over a 10-day period). The table above shows 48 instances of such breadth thrusts emerging since 1947 and the market gains that tend to follow in their wake.
The chart below shows that since 1980 the market has been covered by a breadth thrust signal (i.e., the most recent signal was less than one year in the past) nearly half the time. During such periods, the S&P 500 rose at a better than 12% annualized rate. When not covered by a breadth thrust signal, the S&P 500 saw gains of less than half that. The most recent breadth thrust (from November 2016) expired in
November 2017. The rally off of the 2018 lows has, at least so far, failed to produce a new breadth thrust.”

“Looking at the number of stocks making new 52-week highs (on an absolute basis and relative to the number of stocks making new lows) provides a similar conclusion to that drawn by looking at the percentage of stocks trading above their 200-day averages. We are seeing a series of higher lows but also a lack of upside progress. The number of S&P 500 stocks making new highs has waned as this week has progressed and has remained shy of the number of new highs seen in July or June or March or January. Getting number of stocks making new highs above 75 on a single day basis (or on a 10-day average basis seeing the % of stocks making new highs less new lows exceed 8%) would be evidence that rally participation is expanding.”

We also have a seasonal headwind to overcome as we enter into the Sept. and Oct. months. Mark Hulbert in MarketWatch notes, “Since 1896, when the Dow Jones Industrial Average DJIA, -0.09% was created, the Dow has lost an average of 1.03% in September. That compares to an average gain of 0.76% across all other months of the calendar.
Furthermore, September’s awful record doesn’t trace to just one or two outlier years. In fact, as you can see from the accompanying chart, in all decades but one over the last century September’s performance rank has been below average. That is remarkable consistency.”

The Treasury Market
Bryce Coward from Knowledge Leaders Capital pointed out the crowded short positioning for the 10-year treasury notes. He notes, “Bond positioning reached an extreme short position on April 27th, and has since moved to the second most extreme net short position ever, only eclipsed in April of 2010. When bond shorts grow to extreme levels, interest rates have always fallen over the next six and twelve months. The only other time net shorts as a percent of open interest breached 13%, interest rates fell by 141 basis points six months later.”


Sunny Oh in MarketWatch wrote, “In the last few weeks, Treasury yields have been pinned in by the listless action that characterizes the summer trading doldrums. Below the surface, however, the 10-year Treasury note is caught in a battle between generally bullish money managers and bearish speculative traders. History shows that such battles usually leave speculators bruised, and portends a sharp slide in bond rates, analysts said.”
“According to the U.S. Commodity Futures Trading Commission, net long positions held by asset managers on 10-year Treasury futures rose to more than 1.06 million contracts as of Aug. 21. On the other side, net short positions leveraged funds, consisting of hedge funds and commodity trading advisors rose to 860,000 contracts. The divergence between positions held by asset manager and leveraged funds is now at a record, Nomura data shows.”

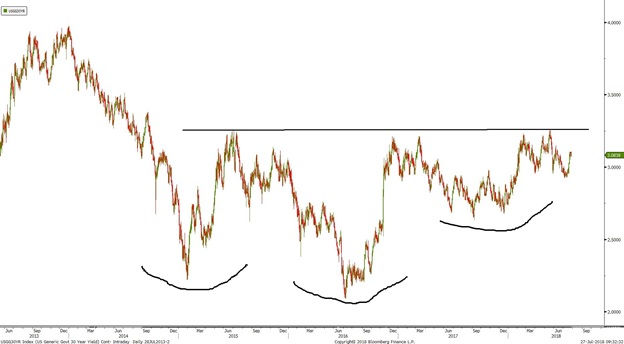
Peter Brandt from Factor Research wrote, “The COT profile is at all-time record extremes in terms of Commercial long and Spec short positions. The daily chart displays a 6-month bottom. While I am a long-term bear on Treasury prices (bull on yields), the COT profile and daily chart suggest a sharp rally could be in the works. I will monitor this market for a buying opportunity.”

He also points out the potential inverted head-and-shoulders pattern on the daily T-bonds chart that is supportive of a near-term risk-off market environment.
The VIX
Erin Swenlin from ChartWatchers believes in the near-term, market weakness should be expected based on patterns within the VIX and other sentiment indicators. “The market made new all-time highs this week, but with the upcoming holiday and short trading week, look for consolidation or continued sell-off. The indicators in the very short term and short term are suggesting a selling initiation. Add to that the highly bullish sentiment charts and it spells weakness in the week ahead.
The ultra-short-term indicators of breadth and the VIX show declining breadth numbers. Granted today advances did outrun declines, but the reading is still lower than the previous positive readings from earlier in the week. The VIX is getting very close to the lower Bollinger Band and a penetration would be a bullish sign, but until then these indicators are suggesting more weakness for the coming week.”

“Short-term indicators are on their way lower and are far from being oversold or even neutral. They can certainly accommodate more downside.”

“Looking at the 10-DMA of the put/call ratio, we can see that bullishness is expanding as they continue lower toward 'oversold' territory. Remember that sentiment is contrarian, so the bullish participants are, the more likely a downside reversal.”

“I also noted in today's sentiment update on MarketWatchers LIVE that both AAII and NAAIM are showing a high degree of bullishness. The American Association of Individual Investors (AAII) bull/bear ratio is near highs and you can see how the weekly numbers are consistently showing more bulls and less bears. We aren't at extremes yet, but it is high enough to suggest a possible reversal to the downside or at least consolidation of this week's move higher.”

“Finally the National Association of Active Investment Managers (NAAIM) shows that exposure is very high. This tells us that NAAIM participants are very exposed to the market and hence bullish.”

“Last chart you should see is the Rydex Ratio chart. We can see that money is rotating away from bear and money market funds and into bull funds.”

She goes on to conclude, “Shorter-term indicators are in decline and suggest weakness ahead for the market. That could come in the guise of consolidation or a pullback. Sentiment is getting very bullish and that suggests a downside reversal. With holiday trading added into the mix, I wouldn't expect to see a strong rally next week.”
Dana Lyons (via MarketWatch) also pointed out an oddity as it related to the relationship between the VIX and the S&P 500. They write, “The S&P 500 and the Cboe volatility index — the so-called fear index — tend to trend in opposite directions since investors have less to worry about when the stock market rallies, and vice versa.
However, in recent days, this well-choreographed relationship has been thrown off balance, with the VIX hovering significantly above its 52-week lows even as the large-cap index continues to carve out new records.”
“Dana Lyons, a partner J. Lyons Fund Management Inc., thinks this divergence deserves closer scrutiny given that such disconnects have previously heralded tough times ahead for stocks.”
“This has happened only three other times in the past two decades, and those were all followed by some “very inauspicious times” for equities, he said.
As the chart below shows, similar divergences occurred from December 1999 to March 2000, April 2007 to October 2007 and December 2014 to February 2015, and short-term returns following those occurrences were quite dismal, with median returns of negative-11.3% in the following year.”

Commodities
We also track the price of gold relative to the price of lumber. We consider this a good gauge of risk-on and off situations. Lumber should rally as the economy is expanding while gold is considered a risk-off safe-haven asset then things get dicey.
When the 10-week rate-of-change of the ratio exceeds 20% and the 20-week slope of the ratio rises above zero, there is usually a bout of market weakness. We are seeing that now as the 10-week ROC is up almost 30% and the slope of the ratio has turned positive. What we haven’t seen yet is a near-term decline in equity prices.

Lastly, we came across this article in Business Insider. “Recent analysis from The Leuthold Group suggests we've already reached this point and are staring down a potential meltdown.
The firm has formulated a new, stock-market-specific twist on a concept called capacity utilization, which it uses to assess the age of an expansion. The logic behind it is simple: The fuller capacity is, the less upside in something.
Leuthold's stock-specific assessment uses five components. And once they're all weighed, the firm finds that utilization is at a more than 70-year high. That's dangerously extended territory, no matter how you look at it.”

We continue to give the economy and the bull market the benefit of the doubt. We wouldn’t be taking short positions at this time and are prepared to keep our strategic long-bias in place. Our shorter-term tactical strategy is to raise cash and remain on the sidelines through Sept. and Oct. There is evidence of near-term headwinds for the market and we locked in gains for the month and year. Once Nov. rolls around we’ll use any pullback as a means to redeploy into the end of the year.
Joseph S. Kalinowski, CFA
Comments