Check back soon
Once posts are published, you’ll see them here.


We’ll provide a brief update on our tactical trading strategy. We’ve made it known several times in the recent past that we were fading the rally and fortunately held a fairly significant cash position into yesterday’s sell-off (please read Seven Reasons To Fade This Rally, The “Low Energy” Rally and A Buying Opportunity Will Present Itself).
We have been favoring 2780 on the SPX as a level to start moving back into the market. We came very close to that level yesterday and by the looks of the SPX futures, we’ll move below that point this morning. We decided to use yesterday’s sell-off to increase our long exposure to the market. At the very least, we think an oversold rebound is in order but do believe additional downside remains afterwards.
Near-term Trading Opportunity
On the daily SPX chart RSI (14) is now in oversold territory and the MACD histogram has fallen below one standard deviation from its 500-day average. These events have usually signaled decent near-term buying opportunities. The percent of companies above their 50-day and 200-day moving averages is nearing short-term capitulation. The SPX new Hi/Lo list has dropped to oversold territory and the SPX has touched the lower two standard deviation boundary on the Bollinger band. All signals for a near-term recovery.

On the NASDAQ, we see 7400 as a 50% Fibonacci retracement from the February lows as potential support and an opportunity to trade higher.

The Russell 2000 has clearly suffered the worst technical damage. Perhaps 1550 is a level to watch as it represents 61.8% Fibonacci retracement from the February lows.

On the SPX weekly chart, looking back to the last two sell-offs, we saw a quick knee-jerk recovery and a follow-up sell-off to make a new low before ultimately washing out and resuming the uptrend. We think that could happen again this time around. The same could be said for the Nasdaq.
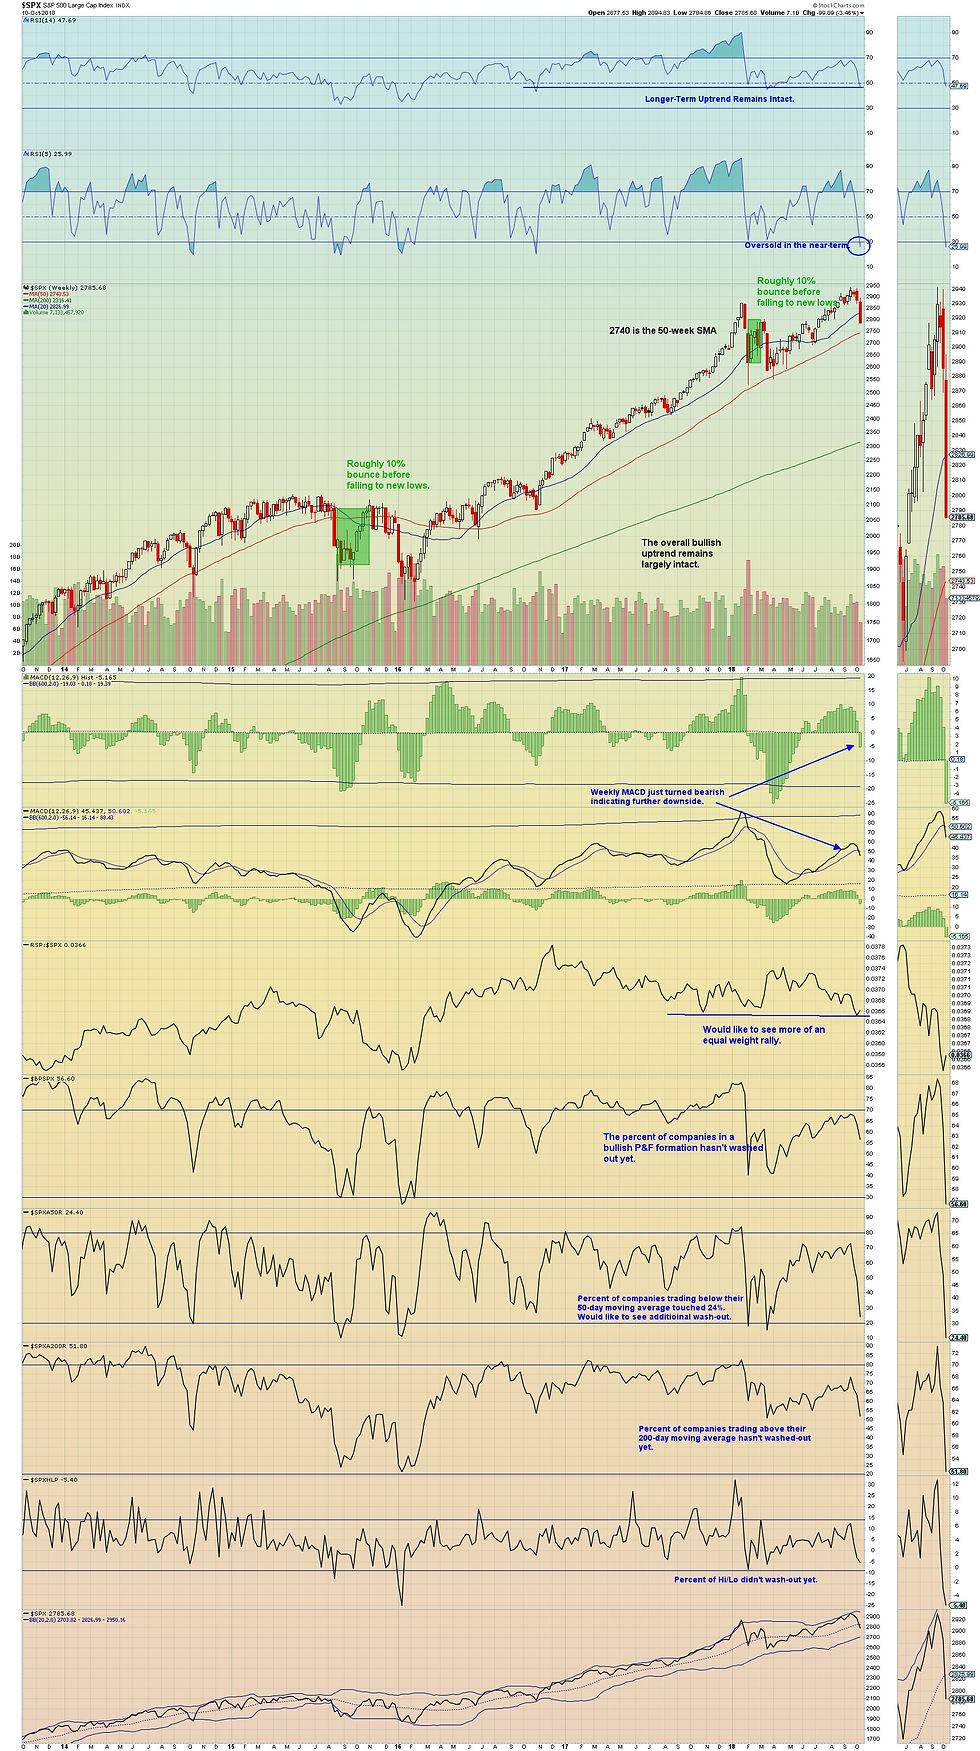

While we are trading for a near-term opportunity, we do not believe the ultimate lows have been placed. On the daily SPX chart, we find the percent of companies in a bullish P&F formation too high to register a capitulation moment. This indicator has a much longer lead time that some of the other indicators and it hasn’t washed out. Also, on the weekly SPX and Nasdaq charts, the MACD line has only crossed the signal line to the downside very recently indicating momentum to the downside is jut getting started on the weekly basis.
The VIX
A few items on the VIX chart give me reason to believe a near-term recovery is in order. The VIX itself closed at 22.96. This marks a region of market panic that has offered good buying opportunities in the past. The spread between the VIX spot and forward has inverted. This backwardation along with a 5-day rate of change (ROC) above 50% has also offered good buying opportunities. The equity put/call ratio is at 1.22, greater than +2 standard deviations from the 500-day average. This is a near-term bullish signal. The differential between the percent of companies in the SPX trading above their 50 and 200-day moving averages has fallen below -2 standard deviations, another sign that a near-term rebound is in order.

Long-term Outlook
Longer-term we remain in the bullish camp and believe this downturn will be a correction and not the start of something bigger. In our post entitled, Remaining in the Longer-Term Bullish Camp for Now, we highlighted some key economic and fundamental reasons to stay positive on the market. That said, many of the “leading” economic indicators may lead the economy but are at best coincident indicators when it comes to the stock market. Most indicators are relatively healthy at the moment and that keeps us in play. That said, with many indicators are bullish extremes and are mean reverting in nature so the situation can change in an instant.
Two key factors, the yield curve (2-10) has not inverted just yet and the monthly technical picture for the SPX hasn’t gone neutral.


We’ve been taking profits on the way up and building cash reserves for a better buying opportunity. We will be deploying cash in the very near-term for a trading opportunity. We expect the market should rebound over the next several weeks (possibly into the end of the year) but also believe the ultimate lows in this selling cycle have yet to be reached.
We’ll be updating our longer-term strategic thesis as we get through earnings season.
Joseph S. Kalinowski, CFA
Comments